---
title: "ServiceNow Integration"
slug: "servicenow-integration"
tags: ["WXP Collaboration"]
updated: 2026-04-09T00:21:09Z
published: 2026-04-09T00:21:09Z
canonical: "learn.workforceexperience.hp.com/servicenow-integration"
---
> ## Documentation Index
> Fetch the complete documentation index at: https://learn.workforceexperience.hp.com/llms.txt
> Use this file to discover all available pages before exploring further.
# ServiceNow Integration
## Introduction
This document is a walk-through on how to configure WXP Collaboration monitors to generate tickets in ServiceNow using webhook notifications. This document also covers the changes required in ServiceNow to enable the integration.
## Requirements
- Create a Scripted REST API in Service Now
- Create a custom Table in Service Now to track alerts coming in
## Configuring Webhooks in WXP Collaboration
This section will walk through setting up a webhook for a monitor in WXP Collaboration.
1. Go to WXP Collaboration Tech Insights Monitoring.
2. Under Monitors on the left menu, click **Rules**.
3. Click **Add Monitor** to configure a new monitor or click an existing monitor's name.
4. Once the Monitor is configured, go to the “**Notify**” section and click “**Add Webhook**”
5. Provide a name for the Monitor and ensure the all the days are selected and the Active Schedule is set from 00:00 to 23:59
6. In the “Data” field, add the following: We will use the example below:
```
Content-Type: application/json
{
"id": "[(${alertId})]",
"name": "[(${name})]",
"description": "[(${category})] [(${metric})] [(${description})] [(${operation})] [(${threshold})] for [(${alertDurationMinutes})] minutes",
"group": "[(${group})]",
"status": "[(${status})]",
"category": "[(${category})]",
"metric": "[(${metric})]",
"alertFiredTime": "[(${alertFiredTimeMs})]"
}
```
**Note: Additional fields can be added by clicking on the following icon: 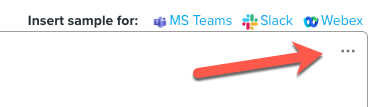
1. Save the Monitor.
## Service Now Setup
To configure ServiceNow to accept webhooks from WXP Collaboration and track the status, both a custom table and a Scripted Rest API are required.
### Custom Table Configuration
1. Head to the Tables located under the System Definition Menu
2. Click “**New**”
3. Fill in the **Label Name**. We recommend using WXPC_alerts
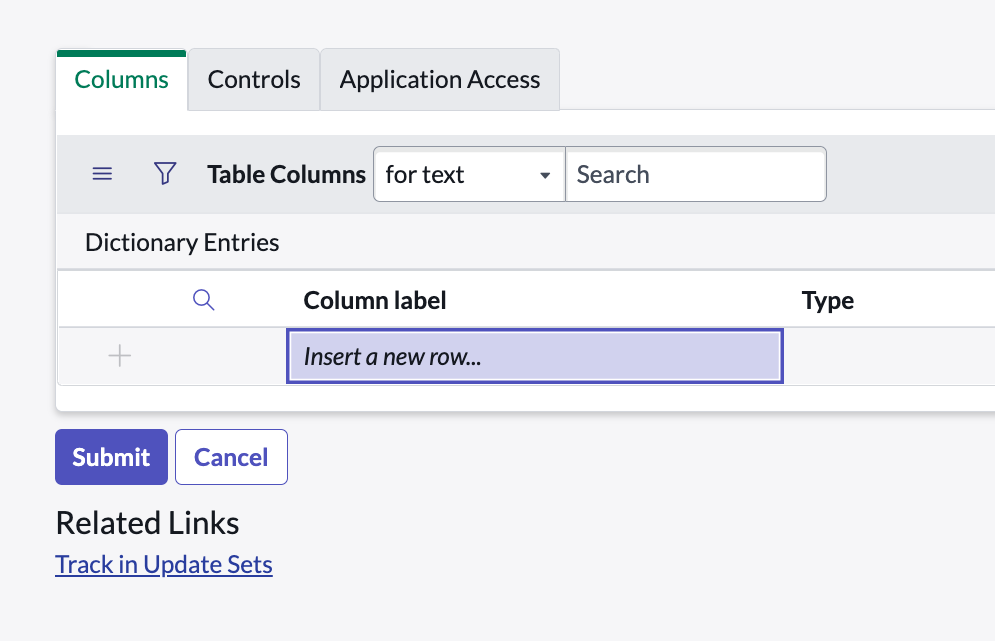
4. Under the Columns Tab, double click on “**Insert a new row**…” as seen below in the Scripted Rest API code snippet:
1. Create the following columns as Type string:
sys_id
WXPC_monitor_id
WXPC_name
WXPC_status
### Create a scripted Rest API
1. Go to “Scripted Rest API” in the ServiceNow Menu
2. On the right-hand side, click the “**New**” button
3. Give the Scripted Rest API the name “WXPC Webhooks” and hit submit
4. Once you hit submit, it exits the area. Search for “WXPC Webhooks” and click it to launch.
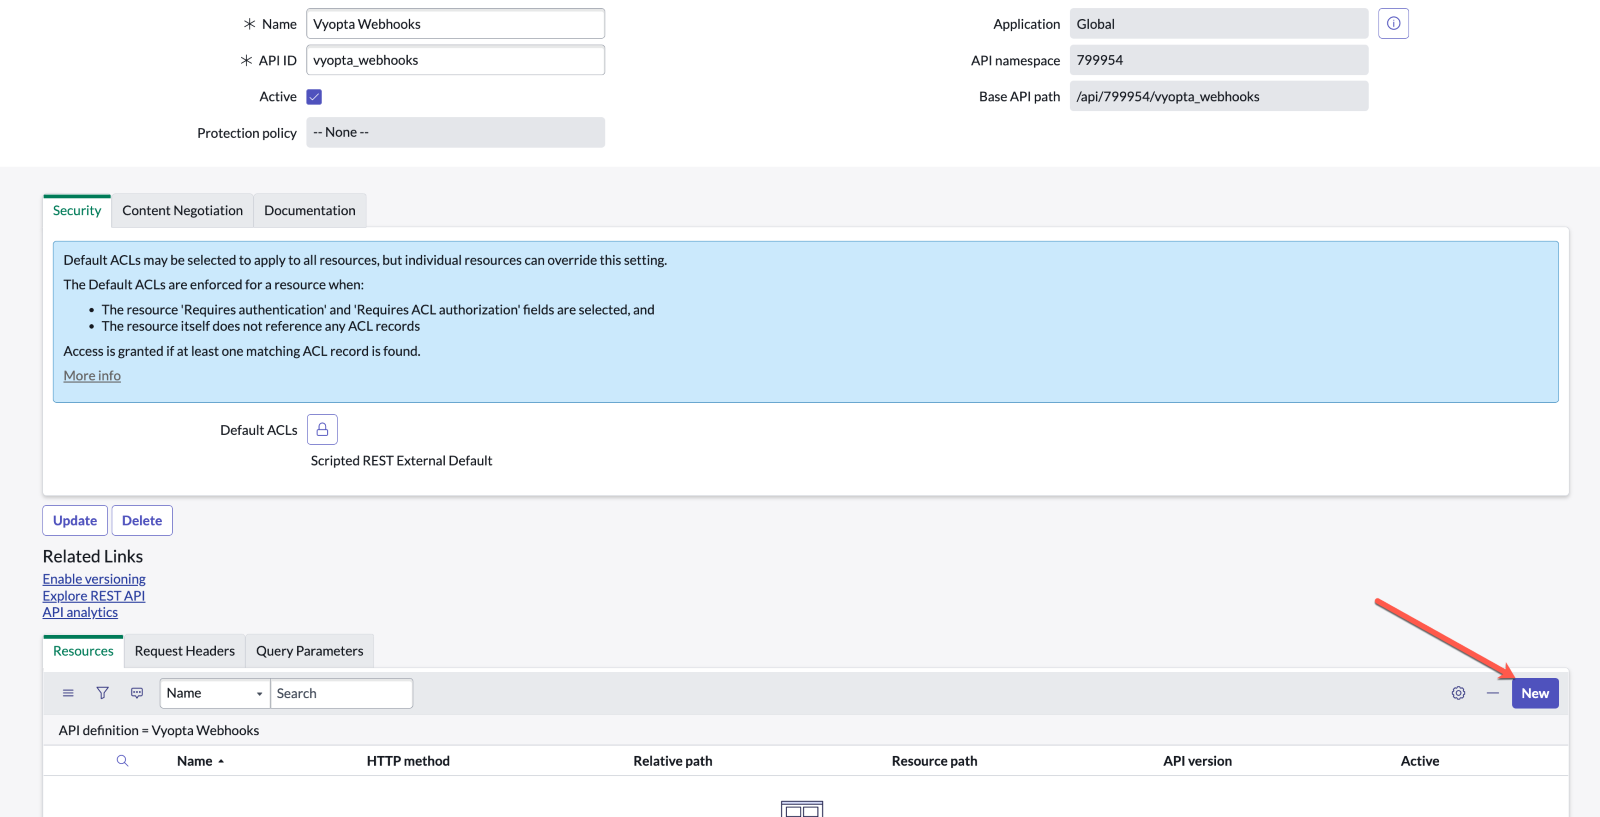
5. Under the resources tab, click **New** as seen in the image below
1. Give the resource a name of “Incoming WXPC Alerts”
2. Change the HTTP Method from “Get” to “Post”
3. Under the Security Tab, uncheck “Requires authentication”
4. Click **Save**
5. Return to “Incoming WXPC Alerts” and paste the following code:
```
(function process(/*RESTAPIRequest*/ request, /*RESTAPIResponse*/ response) {
var requestBody = request.body;
var requestData = requestBody.data;
shortDescription = requestData.id;
description = requestData.name + " " + requestData.status + " " + requestData.category;
/* Need to lookup the DB first before creating an incident. */
var db = new GlideRecord('u_wxpc_alerts');
var query = 'u_wxpc_monitor_id=' + requestData.id + '^' + 'u_wxpc_name=' + requestData.group;
db.initialize();
db.addQuery(query);
db.query();
var issueBody = '[code]';
if(requestData.status === 'CRITICAL') {
issueBody += '
[/code]';
//Check if a record already exists
if(db.next() == true) {
//If record exists, get sys_id of ticket which is u_sys_id
var u_sys_id = db.getDisplayValue('u_sys_id');
var incLookup = new GlideRecord('incident');
incLookup.addQuery('sys_id', u_sys_id);
//If the status is has not changed - Update ticket with worknotes
if(requestData.status === 'CRITICAL' || requestData.status === 'WARN' || requestData.status === 'INFO') {
incLookup.query();
db.setValue('u_wxpc_status', requestData.status);
db.update();
while(incLookup.next()) {
incLookup.work_notes = issueBody;
incLookup.update();
}
} else if (requestData.status === 'CLEAR') {
//If a clear message is sent, update worknotes with a clear message - Also have the ability to close ticket.
db.setValue('u_wxpc_status', requestData.status);
db.deleteRecord();
incLookup.addQuery('sys_id', u_sys_id);
incLookup.query();
while(incLookup.next()) {
incLookup.work_notes = issueBody;
incLookup.update();
}
} else {
//If the status is another status, update worknotes with info.
db.setValue('u_wxpc_status', requestData.status);
db.update();
incLookup.addQuery('sys_id', u_sys_id);
incLookup.query();
while(incLookup.next()) {
incLookup.work_notes = issueBody;
incLookup.update();
}
}
} else {
//If record does not exist in u_wxpc_alerts table - Create a new incident and record it in the table
var grIncident = new GlideRecord('incident');
grIncident.initialize();
grIncident.impact = '2'; //Set the Impact
grIncident.urgency = '2'; //Set the Urgency
grIncident.short_description = requestData.name; //Set Short Description of the ticket
grIncident.description = description; //Set the description of the ticket
grIncident.work_notes = issueBody; //Create a worknote if needed
var sys_id = grIncident.insert(); //Create incident and grab the sys_id of the ticket
db.setValue('u_wxpc_monitor_id', requestData.id); //Set the WXP Collaboration Monitor ID in u_wxpc_alerts table
db.setValue('u_wxpc_name', requestData.group); //Set the WXP Collaboration name in u_wxpc_alerts table
db.setValue('u_wxpc_status', requestData.status); //Set the status in u_wxpc_alerts table
db.setValue('u_sys_id', sys_id); //Set the ticket sys_id in the u_wxpc_alerts table
db.insert();
return 'Insert Into DB';
}
})(request, response);
```
You have now completed the WXP Collaboration / ServiceNow integration! You should now see tickets appear once a monitor alert is triggered!
**Contact Us**
For any assistance, email us at [support@wxp.hp.com](mailto:support@wxp.hp.com).
For FedRAMP-specific support, email us at [fedramp-support@wxp.hp.com](mailto:fedramp-support@wxp.hp.com)